The 10 Best Scientific Illustration Tools in 2026: AI vs. Traditional Software
Introduction: The Visualization Crisis in 2026
In 2026, the scientific community is blessed with more powerful tools than ever before. Yet, the pressure has shifted: it is no longer just about "Publish or Perish," but "Visualize or Vanish."
Whether you are designing a cover for Nature, a visual abstract for social media, or a complex signaling pathway for your thesis, the quality of your figures often determines the impact of your research.
But here lies the dilemma: Do you need the pixel-perfect precision of manual design, or the lightning speed of AI generation?
The choice is no longer about finding a tool, but finding the right tool for your specific workflow. We reviewed the top 10 tools to help you decide which one fits your research style best.
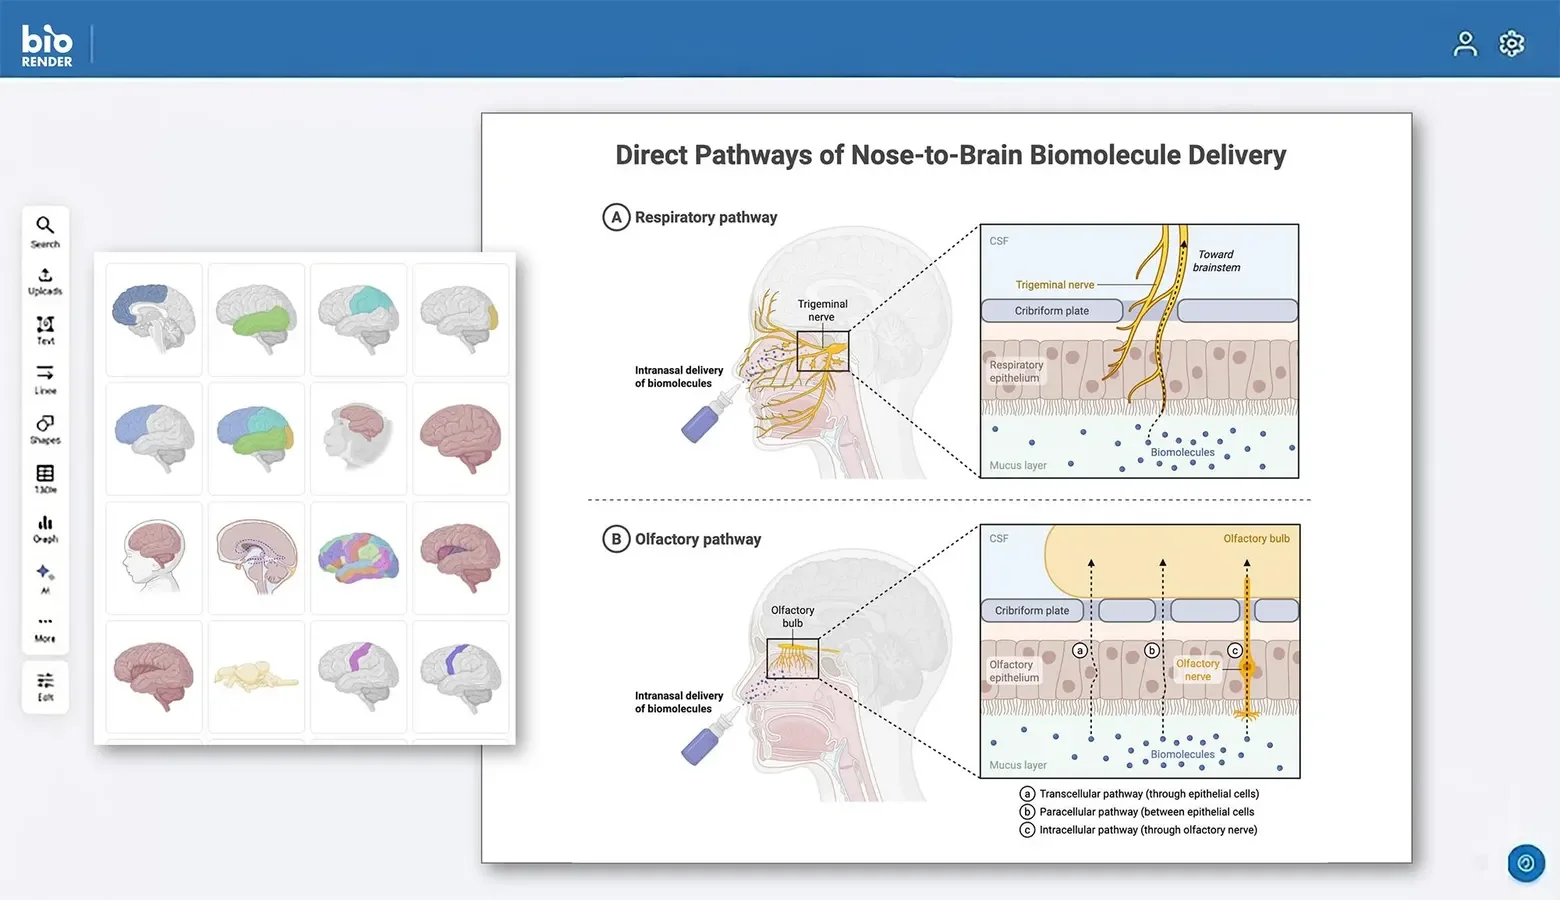
1. BioRender
Best For: Researchers who need a vast, standardized library of biological icons.
BioRender has rightfully earned its place as the industry standard for many labs. It transformed scientific communication by providing a web-based platform pre-loaded with thousands of scientifically accurate icons. Think of it as "digital LEGOs" for biology.
Why it shines:
- Massive Asset Library: From specific immune cells to lab equipment, if it exists in biology, BioRender likely has an icon for it.
- Standardization: It helps research teams maintain a consistent visual style across different publications.
- Collaboration: Excellent cloud features allow teams to comment and edit figures together in real-time.
Considerations: It is fundamentally a manual design tool. You build diagrams by dragging and dropping elements one by one. While it offers great control, it requires significant time and attention to detail.
2. Adobe Illustrator
Best For: High-end journal covers, 3D composition, and professional graphic design.
For those who view scientific illustration as an art form, Adobe Illustrator remains the undisputed king. It offers infinite creative freedom and is the software of choice for professional scientific illustrators.
Why it shines:
- Unlimited Control: You can manipulate every curve, shadow, and anchor point.
- Print Quality: It produces the highest quality vector outputs (EPS/PDF/CMYK) required by top-tier journals.
- Versatility: It handles everything from simple charts to complex 3D-like artistic renderings.
Considerations: It has a steep learning curve. Mastering the Pen Tool takes practice, making it a significant time investment for those serious about design.
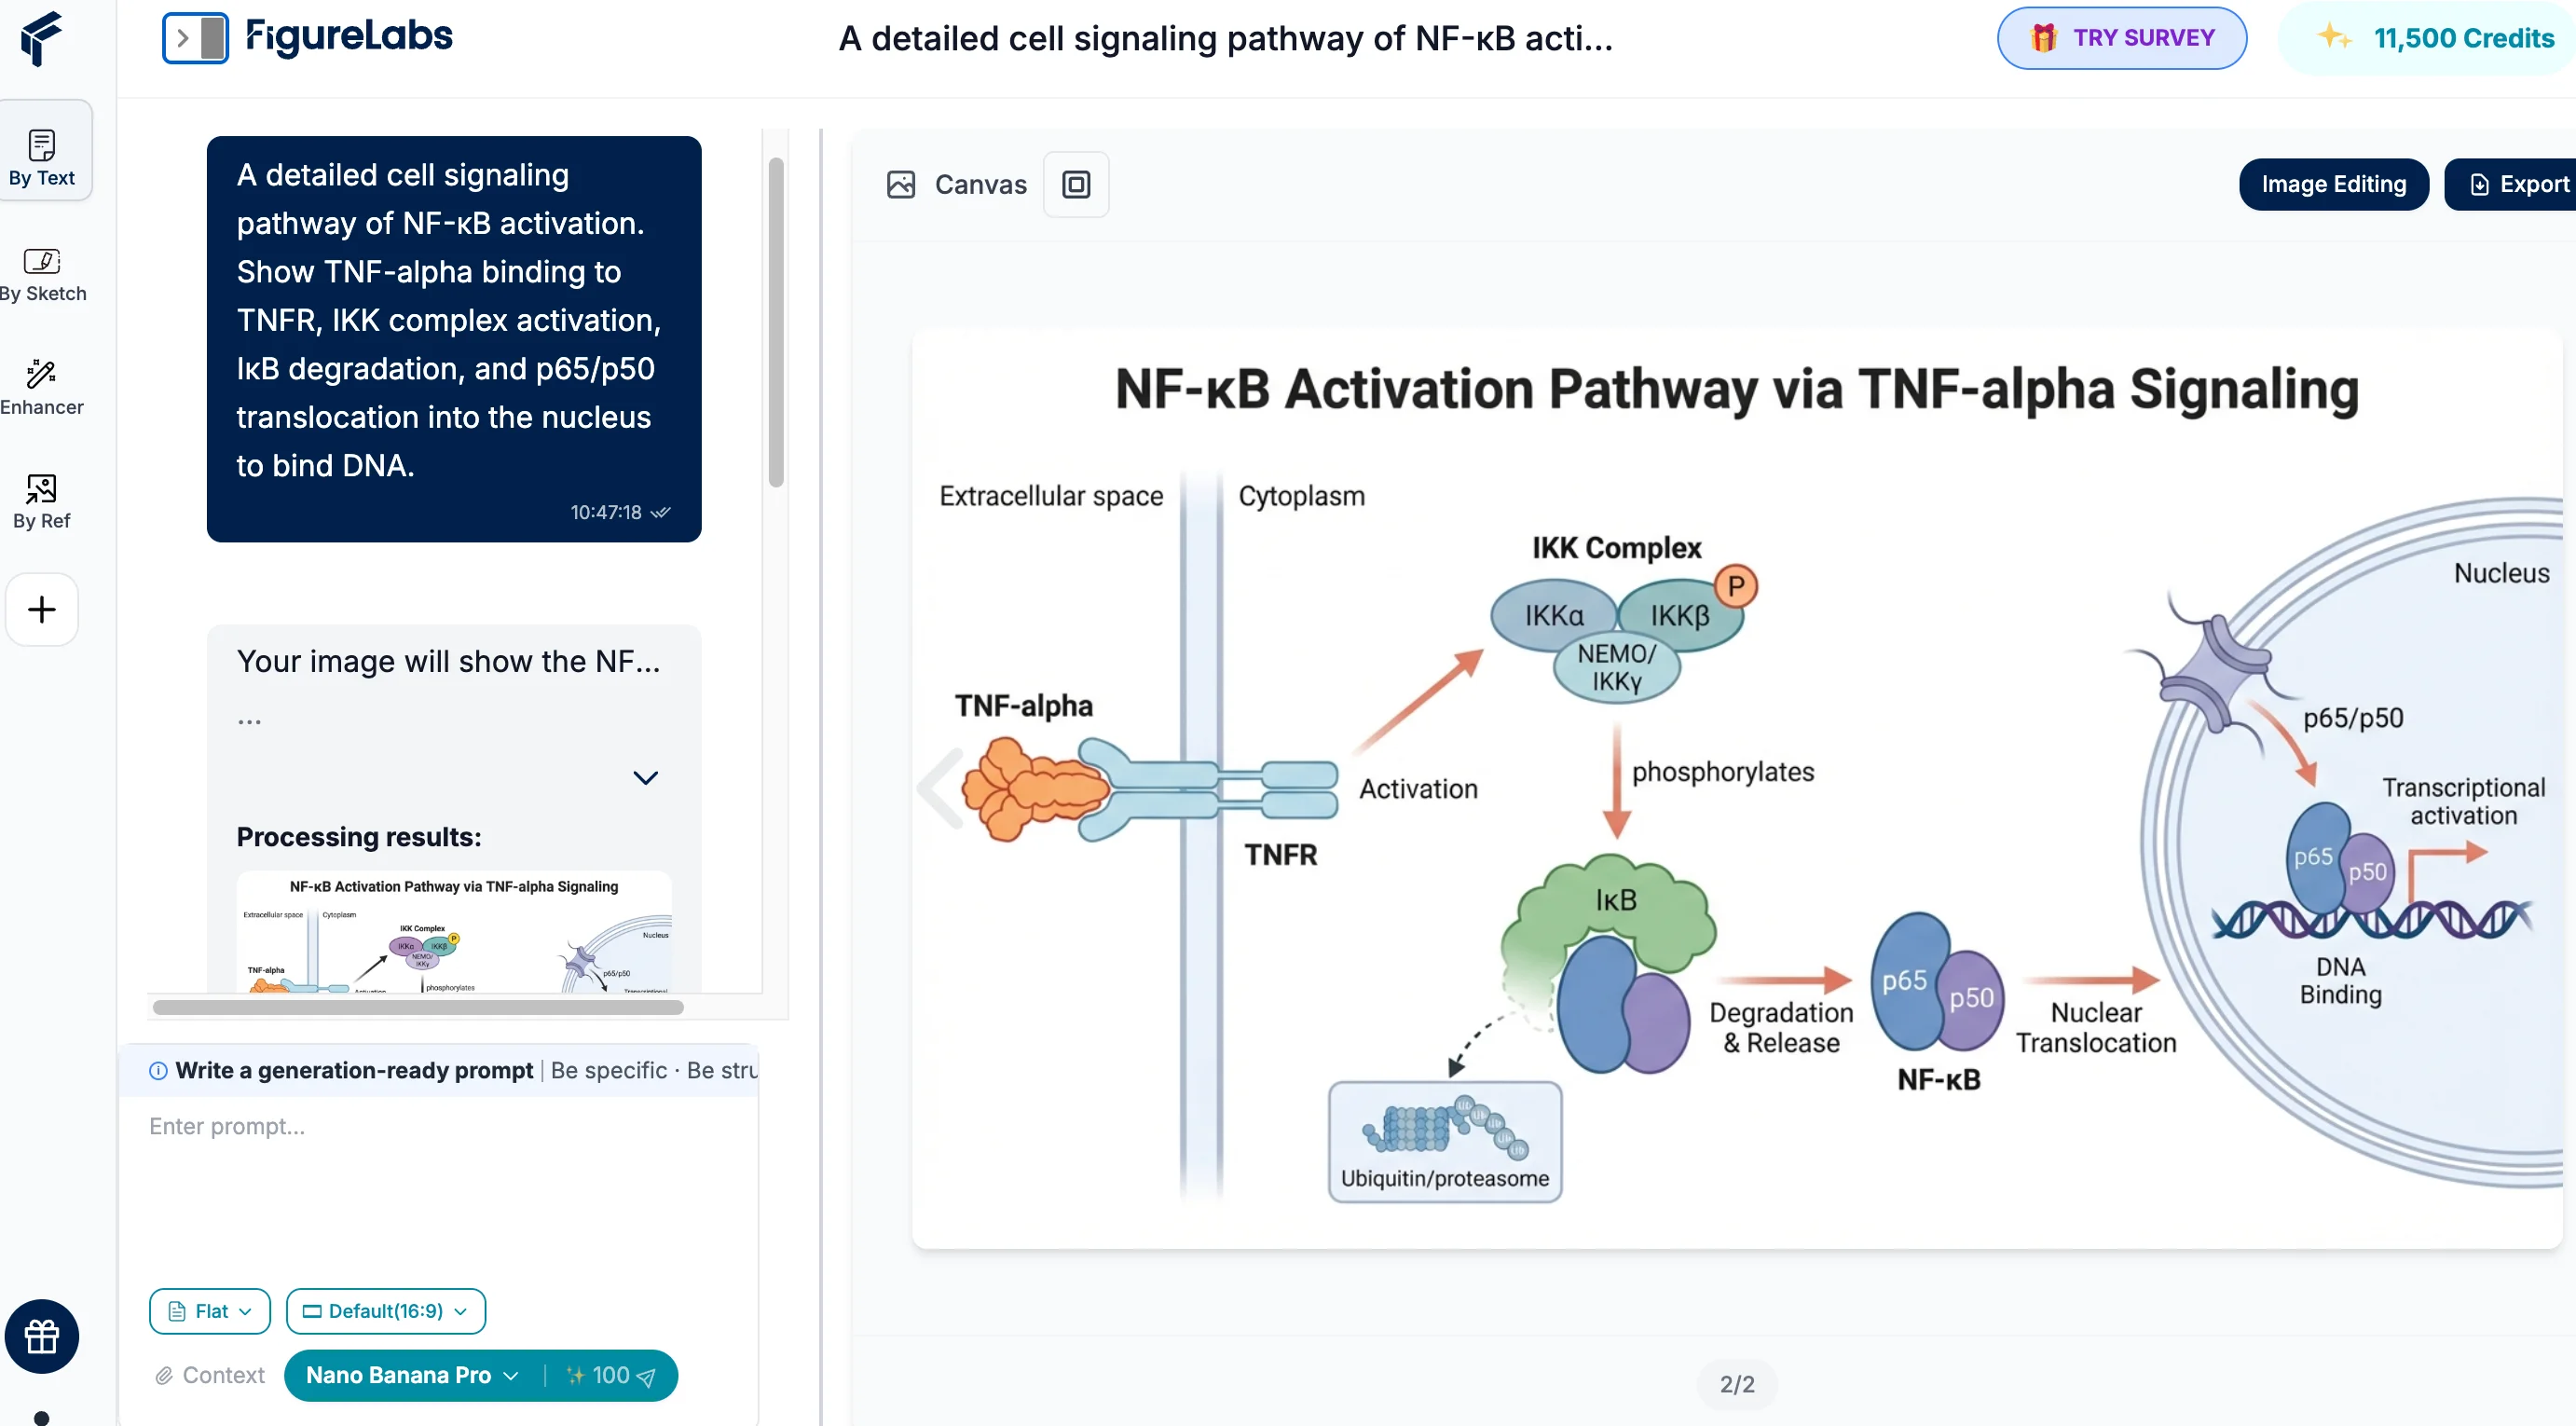
3. FigureLabs
Best For: Accelerating workflows and generating complex pathways instantly.
FigureLabs represents the new wave of AI-assisted science. It is designed to complement your workflow by handling the heavy lifting of initial composition. Instead of starting with a blank canvas, you start with a generated draft.
Why it shines:
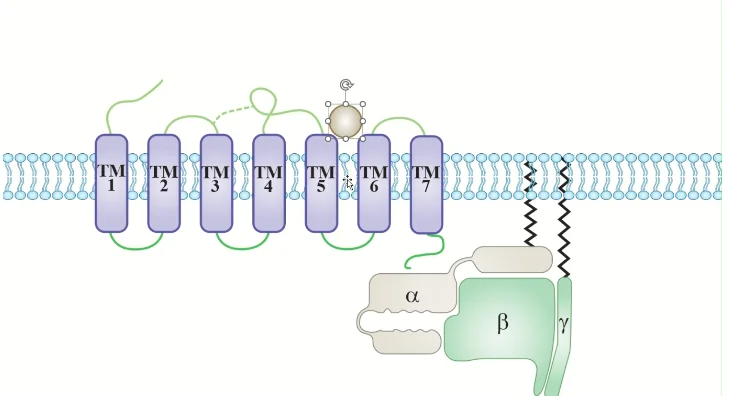
- Speed & Ideation: Its Text-to-Figure engine can visualize complex concepts (like "NF-κB signaling pathway") in seconds, giving you a solid foundation to work from.
- Bridge to Vector (The Killer Feature): The unique One-Click Vectorization feature converts AI-generated concepts into editable SVG paths. This means you can generate a layout instantly and then refine the details manually in its build-in canvas or other tools like Adobe Illustrator.
- Focus on Science: By automating the layout process, it allows researchers to spend less time drawing and more time analyzing data.
Considerations: As a generative tool, it excels at speed and layout, serving as a powerful co-pilot to traditional editing tools rather than a pure replacement for final polishing.
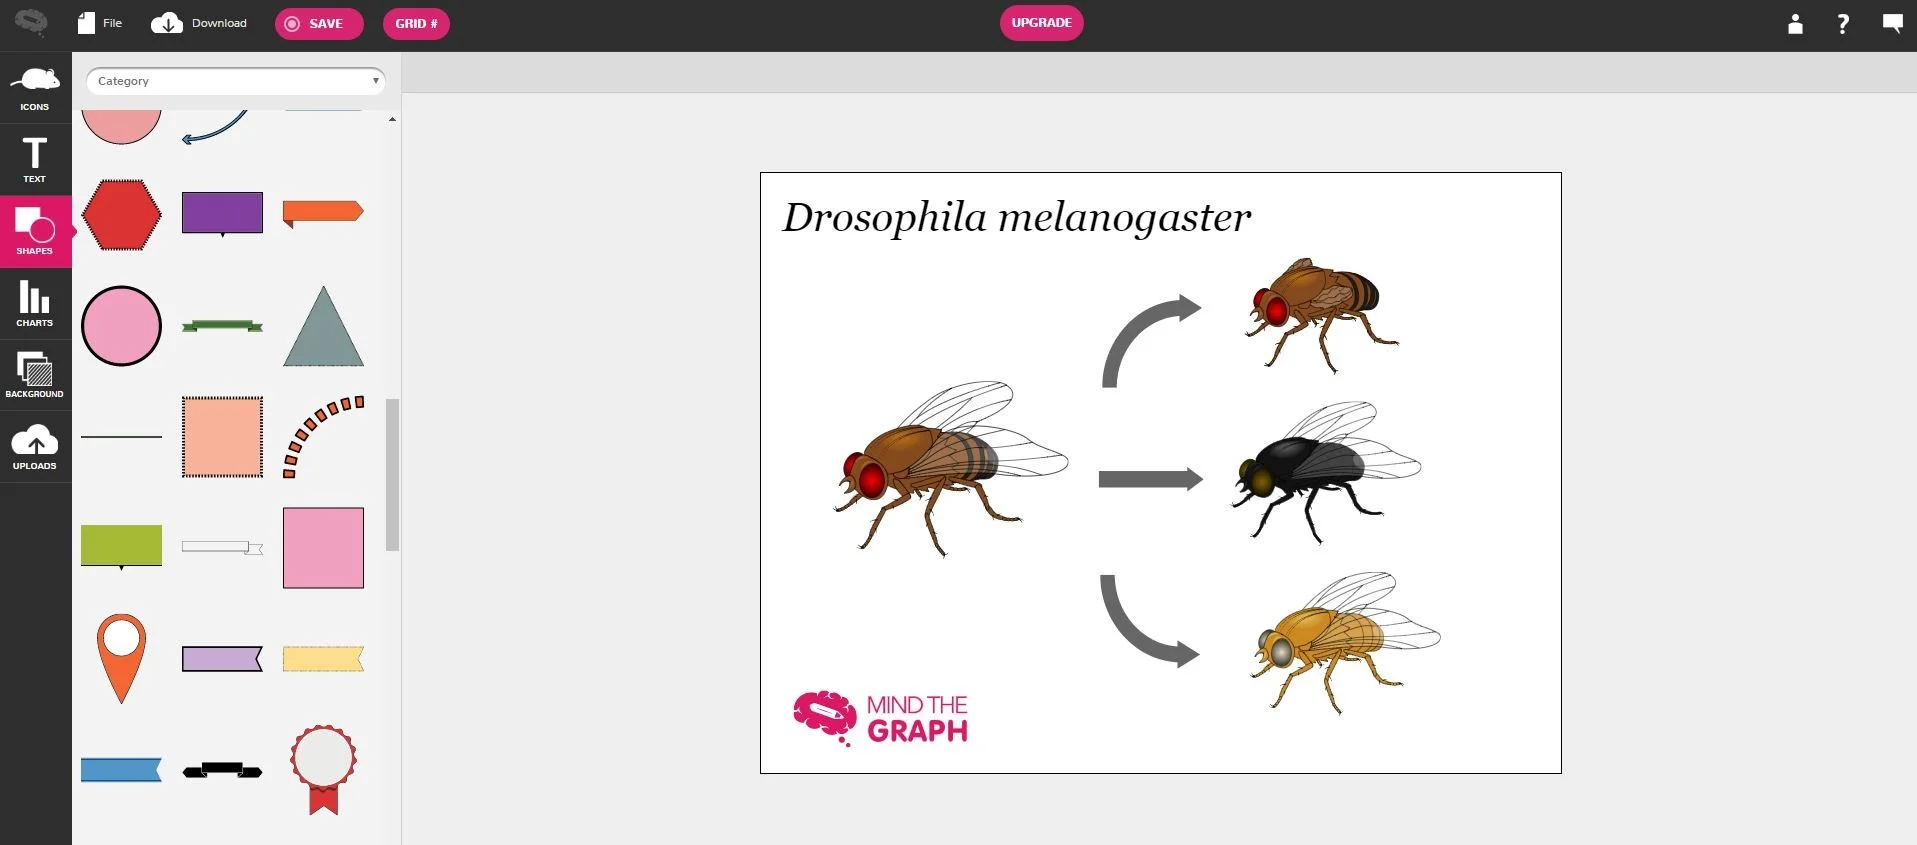
4. MindTheGraph
Best For: Visual abstracts, posters, and slide decks.
MindTheGraph excels at turning complex data into digestible, infographic-style visuals. It bridges the gap between scientific accuracy and presentation aesthetics, focusing heavily on "marketing" your science.
Why it shines:
- Templates: Offers a wide variety of pre-designed templates specifically for visual abstracts and posters.
- Style: The illustrations have a distinct, clean style that works very well for presentation slides and educational materials.
5. PowerPoint
Best For: Quick sketches, lab meeting updates, and slide presentations.
While often underestimated, PowerPoint is the most accessible tool available. With the right plugins (like BioRender or SciDraw add-ins), it can be surprisingly capable.
Why it shines:
- Ubiquity: Everyone has it, and everyone knows how to use it.
- Integration: Seamlessly integrates with your presentation workflow. Great for quickly mocking up ideas before moving to professional software.
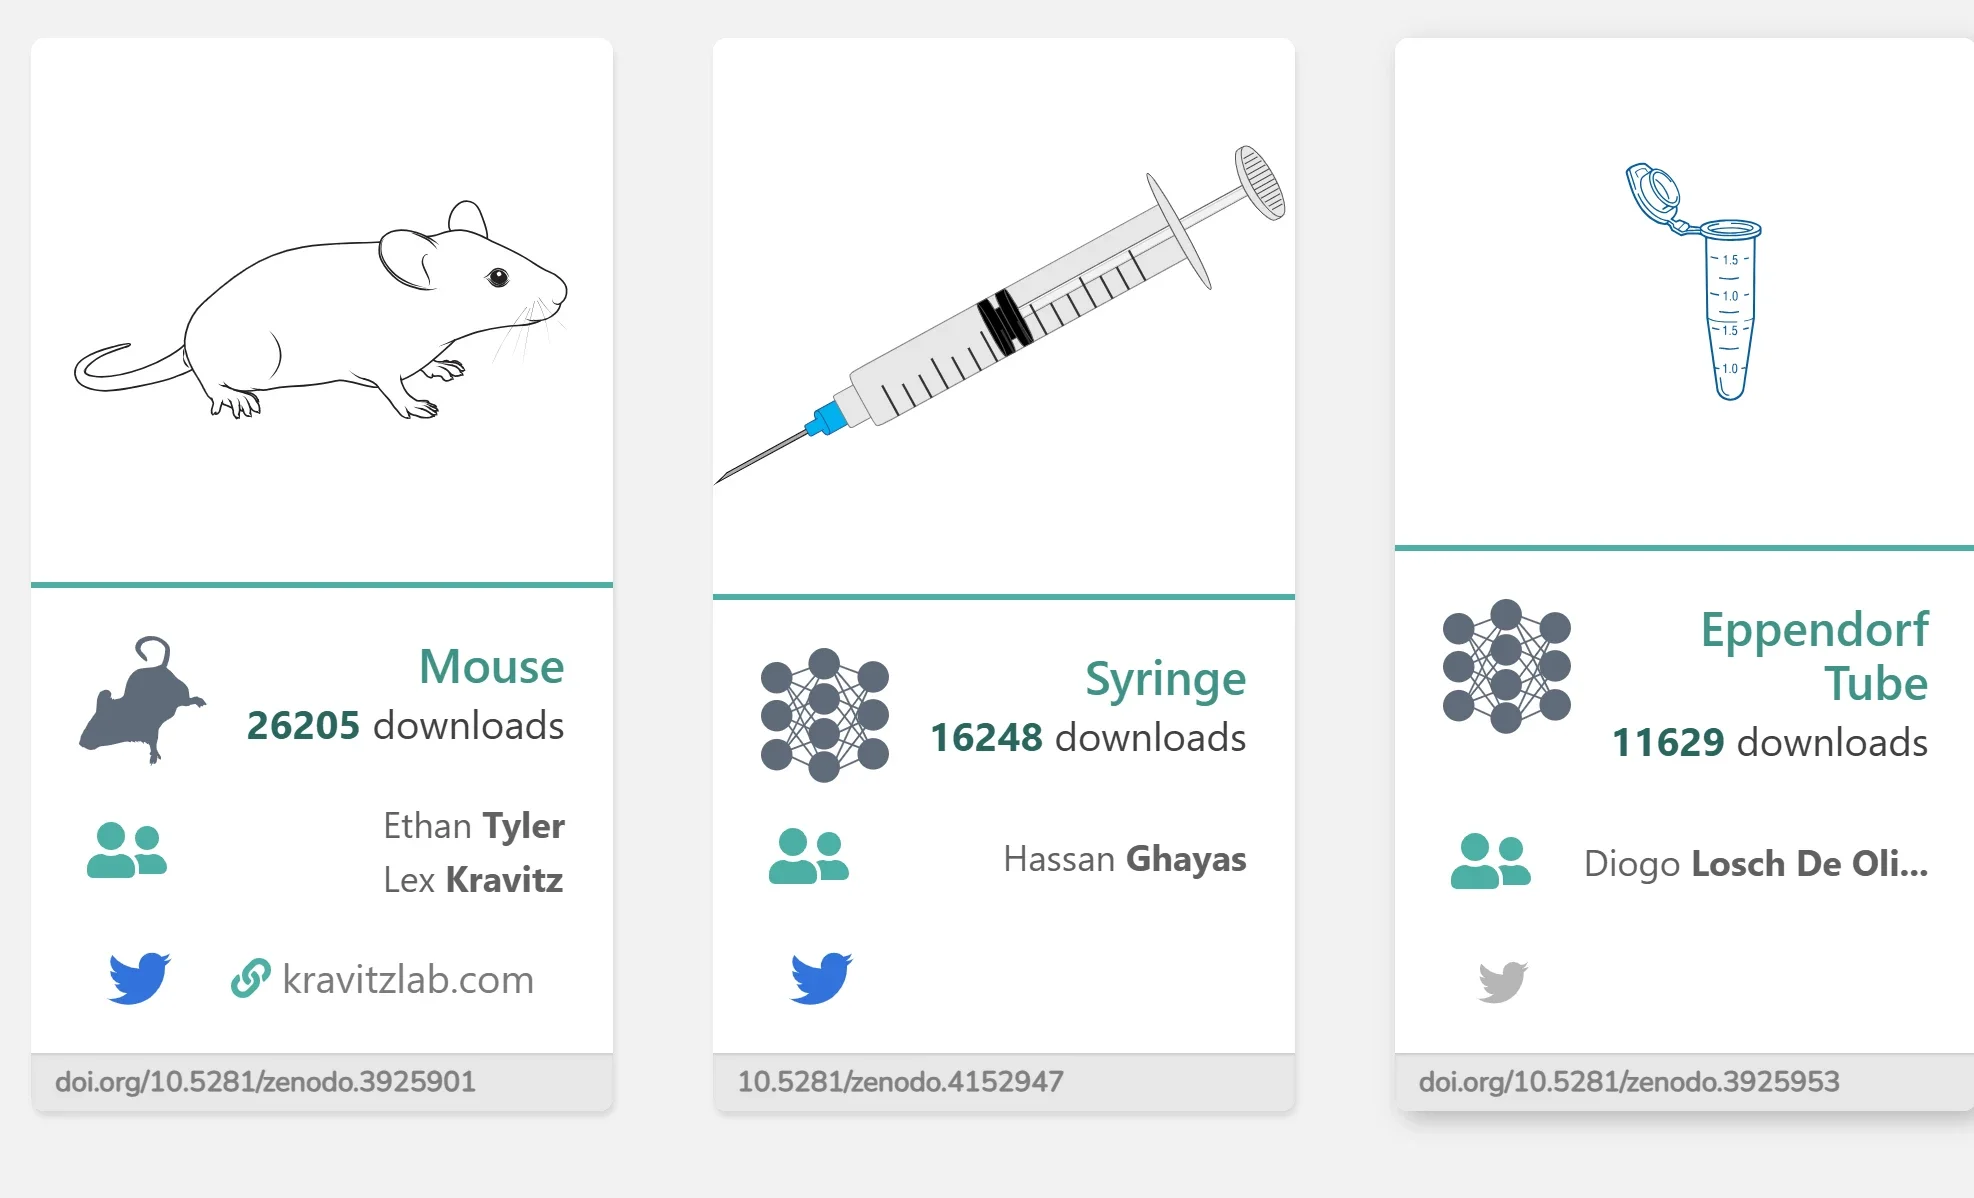
6. SciDraw
Best For: Finding free, community-sourced vector assets.
SciDraw is a fantastic initiative supported by the scientific community. It acts as a repository where scientists share their SVG drawings for others to use freely.
Why it shines:
- Open Source: Completely free and community-driven.
- Flexibility: Since the files are SVGs, they can be imported into Illustrator, Inkscape, or FigureLabs for further editing.
7. Inkscape
Best For: Researchers who want professional vector editing without the subscription cost.
Inkscape is a powerful, free alternative to Adobe Illustrator. It offers robust vector editing capabilities and is widely used in the open-source community.
Why it shines:
- Cost-Effective: It is completely free and open-source.
- Feature-Rich: It supports advanced vector operations, making it capable of producing publication-quality figures if you invest time in learning it.
8. Illustrae
Best For: Students and labs seeking a BioRender-like experience without the enterprise price tag.
As the scientific SaaS market grows, Illustrae has emerged as a strong "challenger brand." It offers a similar drag-and-drop experience to the industry giants but focuses on accessibility and affordability for individual researchers.
Why it shines:
- Cost-Efficiency: Friendly pricing for PhD students.
- User-Friendly: Intuitive interface requiring zero design experience.
9. BioDraws
Best For: Researchers needing high-quality, ready-to-use illustration templates.
BioDraws is a specialized platform that focuses on providing high-quality scientific illustration templates. Unlike complex editing software, it aims to simplify the creation process by offering polished starting points for researchers.
Why it shines:
- Template-First Approach: It empowers researchers by providing professionally designed templates that can be easily adapted.
- Visual Quality: The assets are designed to be visually appealing and scientifically relevant, helping to elevate the aesthetic of publications.
- Simplicity: Ideal for users who want to bypass the steep learning curve of vector design tools and get straight to a finished figure.
10. ChemDraw
Best For: Chemical structures, reaction mechanisms, and property prediction.
If your research involves chemistry in any capacity, ChemDraw is not just a tool; it is a requirement. It is the global standard for communicating chemical concepts.
Why it shines:
- Chemical Intelligence: It understands chemistry (valency, stereochemistry). It can predict NMR spectra and calculate stoichiometry.
- Universal Format: The .cdx file format is the industry standard.
- Precision: Ensures bond angles and electron pushing arrows are drawn to IUPAC standards automatically.
Summary: Which Tool Should You Choose in 2026?
The landscape of scientific illustration has shifted from a "one-size-fits-all" approach to a diverse ecosystem of specialized tools. Your choice depends entirely on your priority: Control vs. Efficiency.
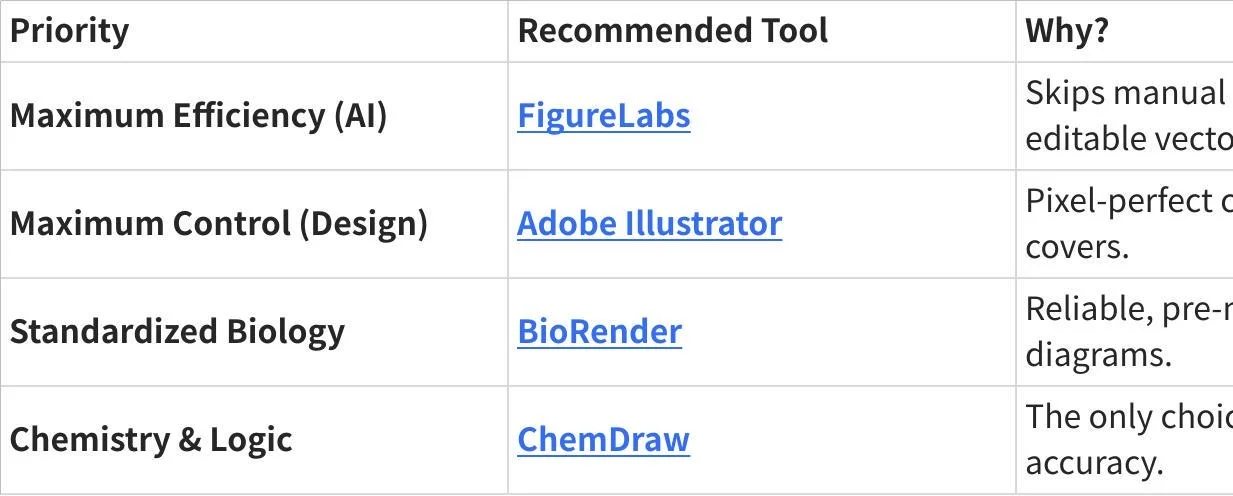
The Verdict:
In 2026, the smartest workflow is often a hybrid one. Use FigureLabs to generate your core concepts and layout instantly, and then use tools like PowerPoint or Illustrator for final labeling. The era of drawing every single cell by hand is over—welcome to the era of AI-assisted science.
Ready to try the AI-first approach? 👉 Try FigureLabs for Free