Mastering Scientific AI Prompts: How to Talk to FigureLabs
Introduction: Why Your First AI Figure Probably Looked Terrible
You heard about AI figure generation. You were excited. You typed "draw a cell" and hit enter.
The result? A blob that looked like it was drawn by a caffeinated kindergartner.
Here is the truth: AI is only as good as your prompt.
The difference between a figure that looks like clip art and one that looks like it belongs in Cell is not the AI---it is how you talk to it.
This guide will teach you the exact formulas, structures, and templates to get publication-quality results every time.
The Anatomy of a Perfect Scientific Prompt
After analyzing thousands of successful prompts, we have identified four essential components:
The S.S.V.D. Formula
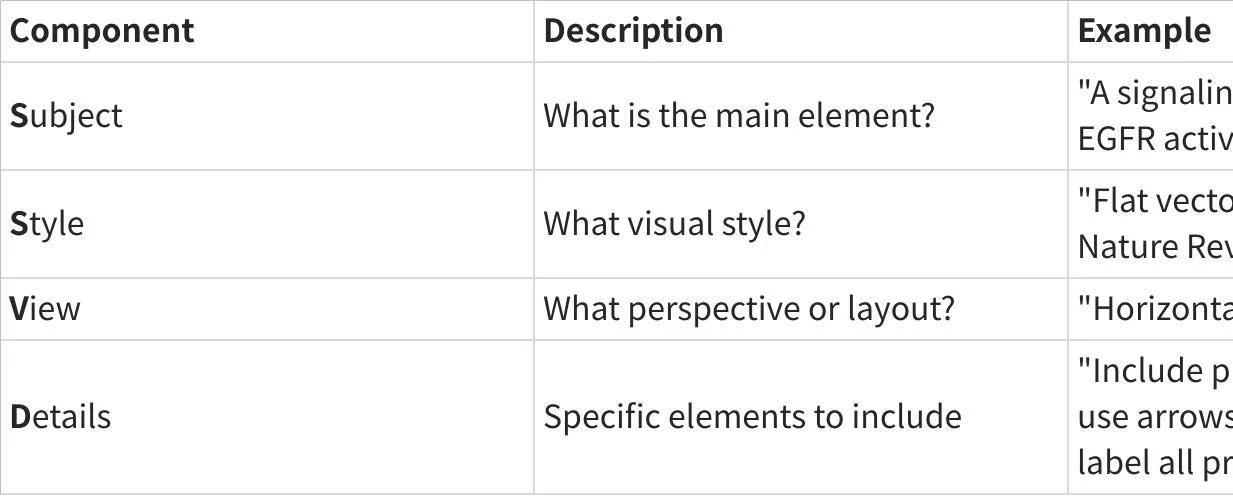
Full Prompt Example:
"Create a signaling pathway showing EGFR activation leading to MAPK cascade. Use a flat vector style suitable for Nature Reviews. Layout should be horizontal, left-to-right. Include phosphorylation events (marked with 'P'), use arrows to show signal flow, and label all proteins with their standard abbreviations."
10 Ready-to-Use Prompt Templates
Template 1: Cell Signaling Pathway
"Create a [PATHWAY NAME] signaling pathway showing [START POINT] to [END POINT]. Include [KEY PROTEINS/MOLECULES]. Use [COLOR SCHEME] colors. Style: flat vector, suitable for [JOURNAL NAME]. Add phosphorylation markers where appropriate."
Example:
"Create a PI3K/AKT signaling pathway showing receptor activation to cell survival. Include PI3K, PIP2, PIP3, AKT, and mTOR. Use blue-to-green gradient colors. Style: flat vector, suitable for Cell Reports. Add phosphorylation markers where appropriate."
Template 2: Crystal Structure
"Draw a [CRYSTAL TYPE] crystal structure showing [SPECIFIC FEATURES]. View: [PERSPECTIVE]. Highlight [SPECIFIC ATOMS/BONDS] in [COLOR]. Style: ball-and-stick / space-filling / wireframe."
Example:
"Draw a perovskite ABX3 crystal structure showing the octahedral coordination. View: 3D perspective with slight tilt. Highlight the B-site cation in blue and X-site anions in red. Style: ball-and-stick with transparent polyhedral overlay."
Template 3: Experimental Setup
"Illustrate a [TECHNIQUE NAME] experimental setup including [COMPONENTS]. Show [BEAM/FLOW/SIGNAL] path with arrows. Label all components. Style: schematic diagram with [COLOR SCHEME]."
Example:
"Illustrate a confocal microscopy experimental setup including laser source, beam splitter, objective lens, sample stage, pinhole, and detector. Show light path with green arrows. Label all components. Style: schematic diagram with grayscale components and colored light paths."
Template 4: Workflow/Process Diagram
"Create a [NUMBER]-step workflow showing [PROCESS NAME]. Steps: [STEP 1] → [STEP 2] → [STEP 3]. Use icons for each step. Layout: horizontal/vertical. Style: minimalist with [COLOR] accent color."
Example:
"Create a 5-step workflow showing CRISPR gene editing. Steps: sgRNA design → Cas9-sgRNA complex formation → DNA binding → Double-strand break → Repair (NHEJ/HDR). Use icons for each step. Layout: horizontal. Style: minimalist with blue accent color."
Template 5: Comparison Diagram
"Create a side-by-side comparison of [ITEM A] vs [ITEM B]. Show [COMPARISON CRITERIA]. Use [COLOR A] for [ITEM A] and [COLOR B] for [ITEM B]. Include labels and a dividing line."
Template 6: Mechanism Illustration
"Illustrate the mechanism of [PROCESS]. Show [NUMBER] stages: [STAGE 1], [STAGE 2], [STAGE 3]. Include molecular details at [LEVEL OF DETAIL]. Style: [JOURNAL] figure style."
Template 7: Anatomical/Structural Cross-Section
"Draw a cross-sectional view of [STRUCTURE]. Label [COMPONENTS]. Show scale bar. Use [COLOR SCHEME] to differentiate layers. Style: scientific illustration."
Template 8: Data Visualization Concept
"Create a conceptual figure showing [RELATIONSHIP/TREND]. Use [CHART TYPE] as the base. Overlay with [ICONS/ANNOTATIONS]. Style: infographic suitable for graphical abstract."
Template 9: Timeline/Evolution Diagram
"Create a timeline showing [TOPIC] from [START] to [END]. Include [NUMBER] key milestones. Use icons to represent each milestone. Style: horizontal timeline with [COLOR] theme."
Template 10: Multi-Panel Figure Layout
"Design a [NUMBER]-panel figure layout for [TOPIC]. Panel A: [CONTENT]. Panel B: [CONTENT]. Panel C: [CONTENT]. Maintain consistent style across panels. Add panel labels (A, B, C)."
Common Prompt Mistakes (And How to Fix Them)
Mistake 1: Being Too Vague
❌ "Draw a protein"
✅ "Draw the 3D ribbon structure of GFP (green fluorescent protein) showing the beta-barrel and central chromophore. Highlight the chromophore in bright green."
Mistake 2: Forgetting the Style
❌ "Create a cell diagram"
✅ "Create a cell diagram in flat vector style with thin black outlines, suitable for a Nature Methods figure. Use pastel colors for organelles."
Mistake 3: Overloading the Prompt
❌ "Draw a complete cell with all organelles, all signaling pathways, all proteins, DNA replication, transcription, translation, and metabolism"
✅ Focus on ONE concept per figure. Complex ideas need multiple panels.
Mistake 4: Ignoring Layout
❌ "Show the process"
✅ "Show the process as a left-to-right horizontal flowchart with 5 steps"
Advanced Techniques: Iterative Refinement
The best figures rarely come from a single prompt. Here is a professional workflow:
Round 1: Generate the Base
Start with a comprehensive S.S.V.D. prompt. Get the overall structure right.
Round 2: Refine Specific Elements
"Keep the overall layout, but make the arrows thinner and change the receptor color to blue."
Round 3: Polish for Publication
"Increase the font size of all labels by 20%. Ensure all text is in Arial font."
Why Prompt Skills Matter for Your Career
In 2026, "AI literacy" is becoming as important as statistical literacy was a decade ago.
Researchers who can effectively communicate with AI tools will:
- Produce figures faster
- Iterate more quickly during revision
- Spend more time on science, less on design
The 30 minutes you invest in learning prompt engineering will save you hundreds of hours over your career.
Conclusion: Your Prompt Is Your Superpower
The AI does not read your mind. It reads your prompt.
A vague prompt produces a vague figure. A precise prompt produces a publication-ready masterpiece.
Start with the S.S.V.D. formula. Use the templates. Iterate.
Your next figure is one good prompt away.