How to Create Professional Cell Signaling Pathways with FigureLabs
Is there anything more frustrating than spending 3 hours drawing a diagram that takes 3 minutes to explain?
For years, researchers have relied on "drag-and-drop" tools like BioRender or PowerPoint. The workflow is always the same: search for a receptor, drag it, search for a ligand, drag it, draw a line, adjust the curve, change the color... and repeat 50 times.
If you are trying to visualize complex pathways like NF-κB, MAPK, or Apoptosis, this manual process is a massive productivity killer.
Enter FigureLabs.
Today, we're showing you how to switch from drawing to generating. We will create a publication-ready signaling pathway in minutes using AI, not hours of manual labor.
The Old Way vs. The AI Way
Before we dive into the tutorial, let's look at the math:
The Traditional Method (BioRender/PPT):
- Search for individual icons (Nucleus, Cytokine, DNA).
- Manually align and distribute objects.
- Draw arrows one by one to represent phosphorylation or translocation.
Time Cost: 2-3 Hours.
The FigureLabs Method:
- Describe the pathway or upload a sketch.
- AI generates the complete scene.
- Convert to SVG for final tweaks.
Time Cost: < 10 Minutes.
Method 1: Text-to-Figure (The Fastest Workflow)
Best for: Standard pathways (NF-κB, JAK-STAT, MAPK) or clear conceptual diagrams.
Step 1: Input Your Prompt
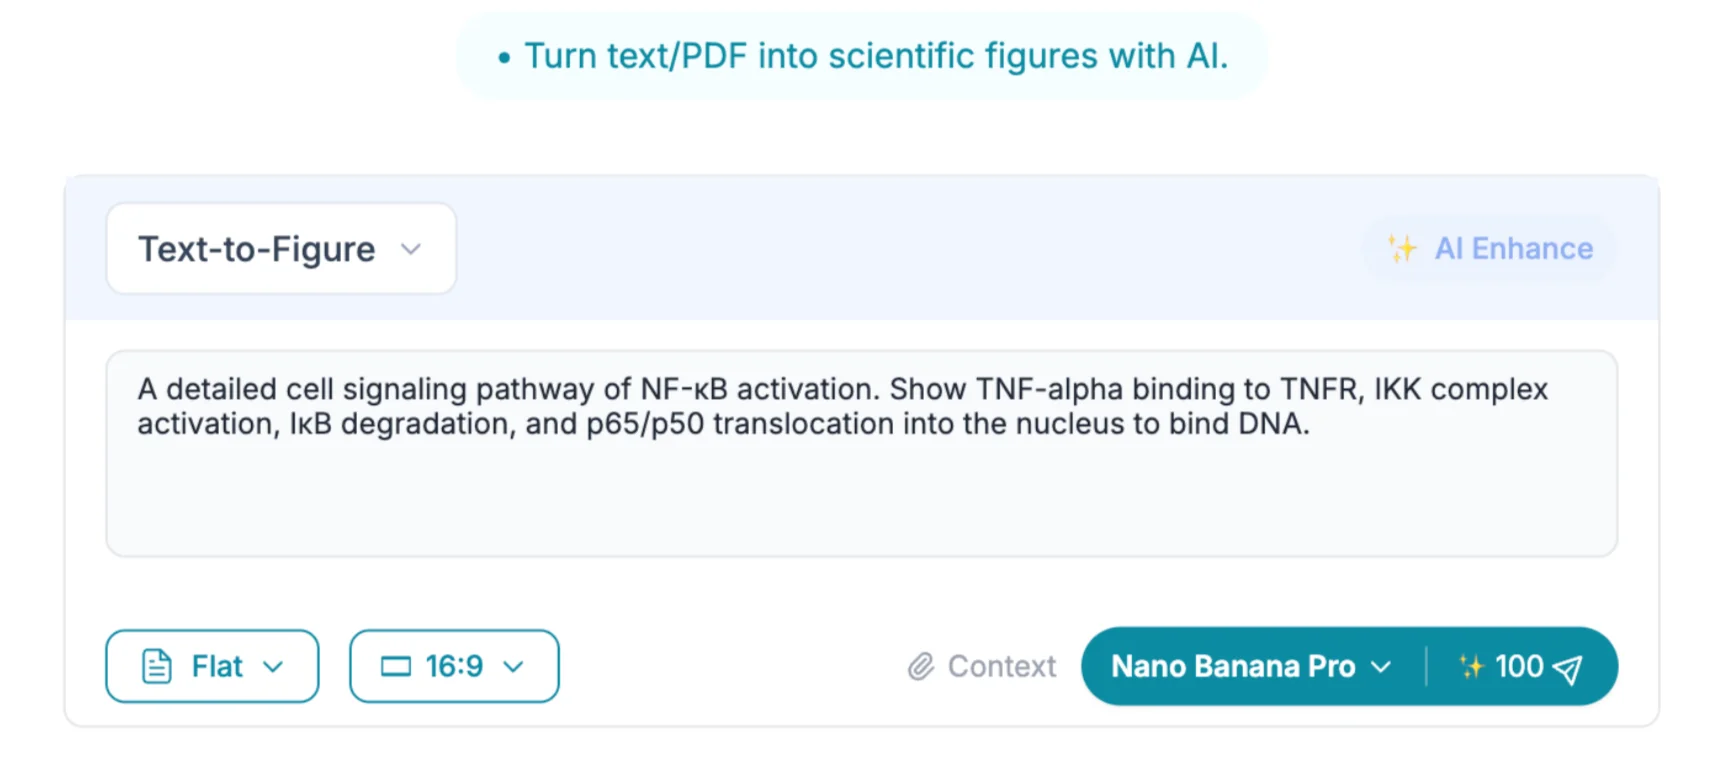
Go to FigureLabs.ai and select the Text-to-Figure tool. Instead of searching for a "protein shape," describe the biological process.
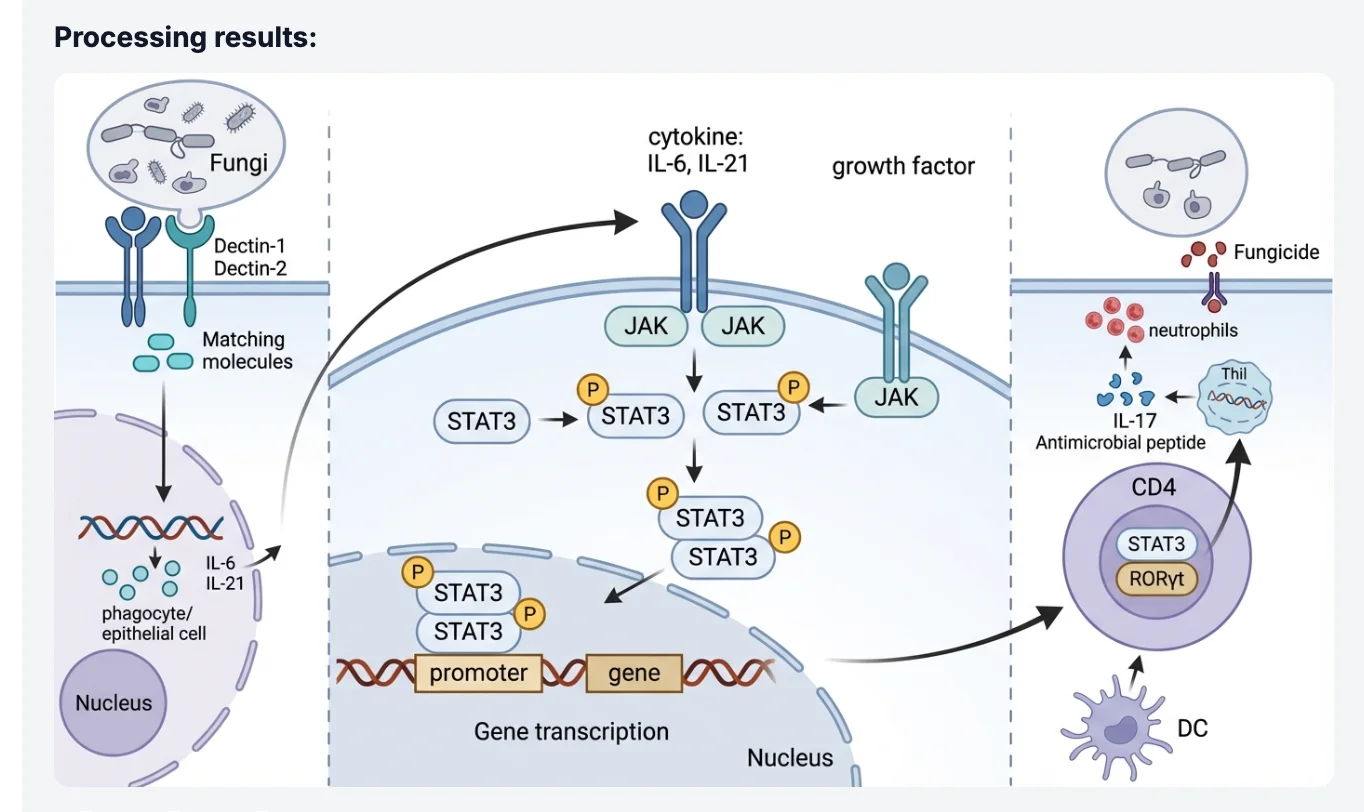
Prompt Example: "A detailed cell signaling pathway of NF-κB activation. Show TNF-alpha binding to TNFR, IKK complex activation, IκB degradation, and p65/p50 translocation into the nucleus to bind DNA."
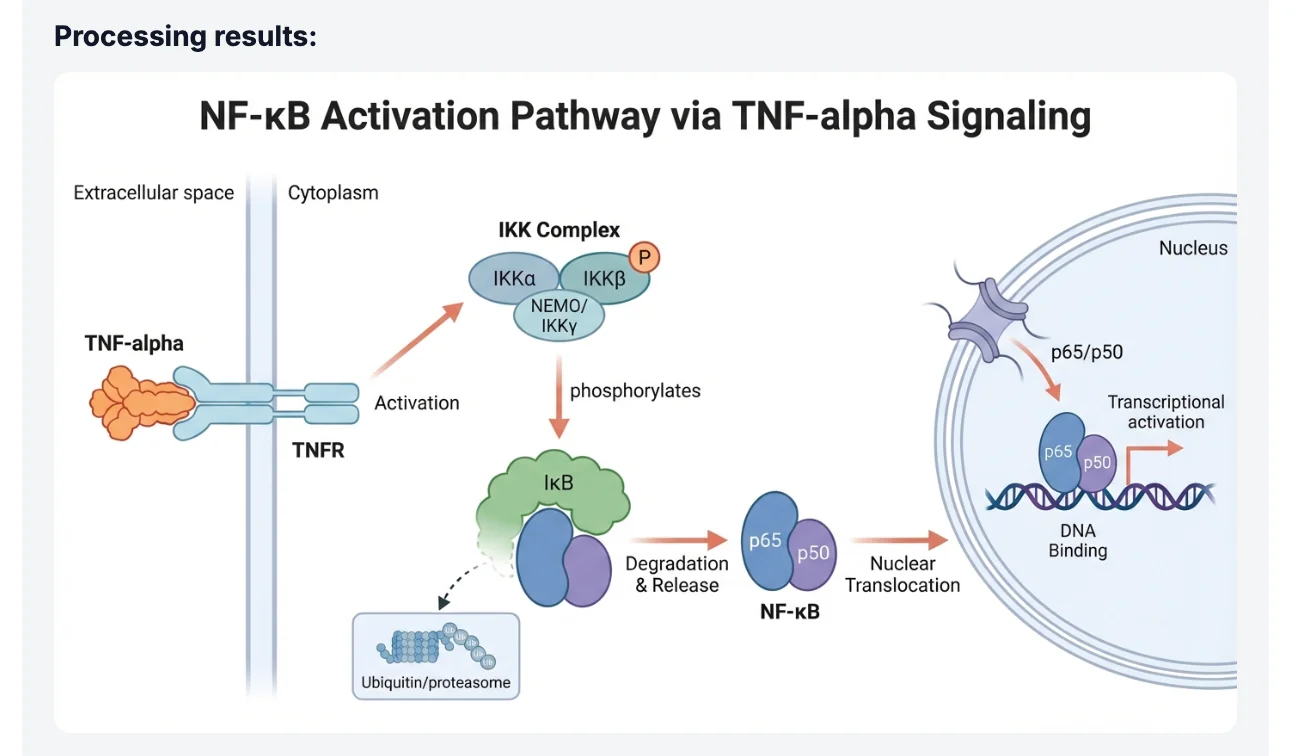
Step 2: Generate
FigureLabs' AI Agent understands biological context. It doesn't just place random shapes; it understands that receptors sit on the membrane and transcription factors move to the nucleus. Within seconds, you get a professional figure.
Method 2: Image-to-Figure (From Napkin to Nature)
Best for: Custom, novel pathways or specific layouts you have already sketched out.
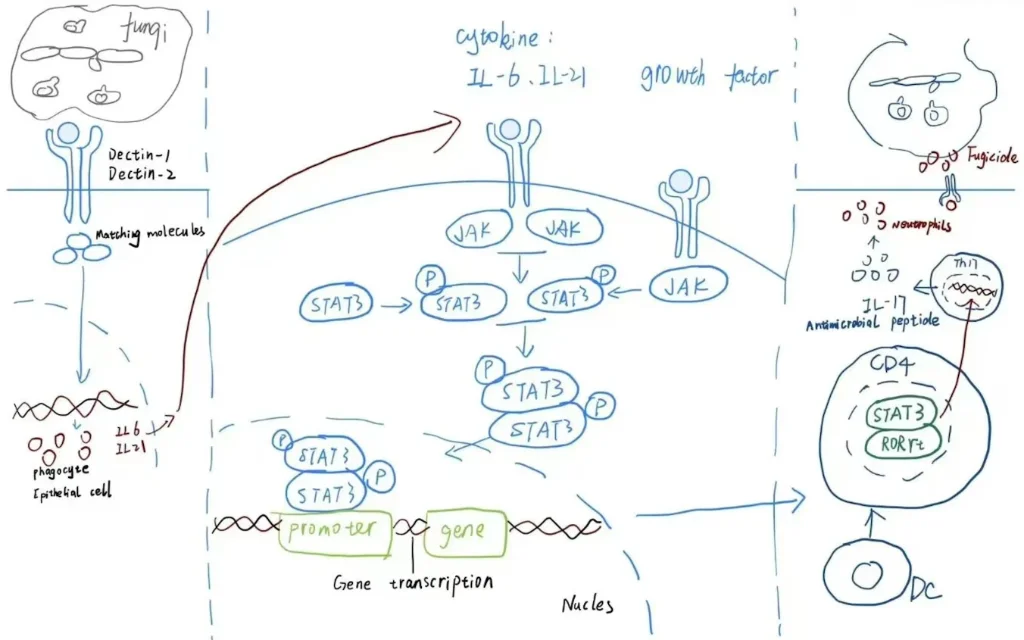
Step 1: Upload Your Sketch
Maybe you drew the mechanism on a whiteboard during a lab meeting, or scribbled it on a napkin. Take a photo and upload it to the Image-to-Figure feature.
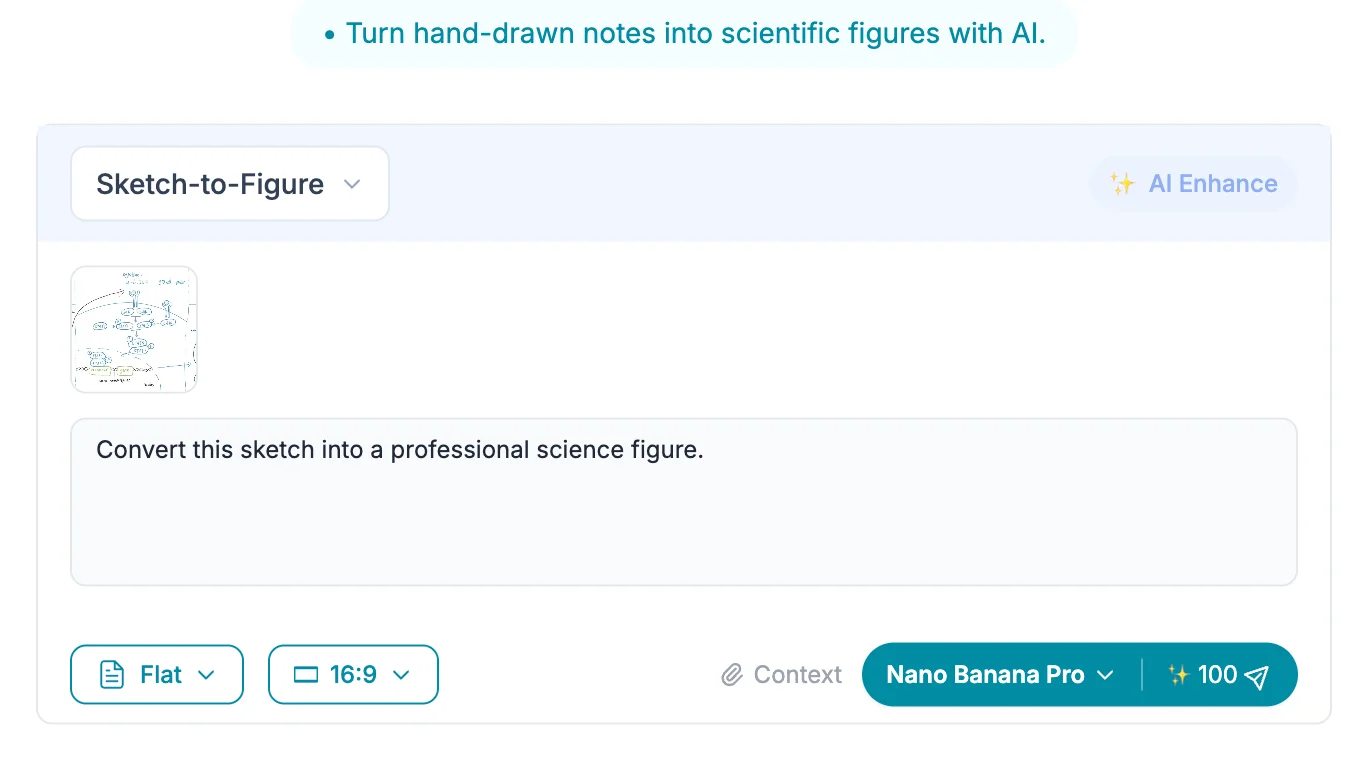
Step 2: Add a Description
Help the AI understand your sketch.
Prompt: "Convert this sketch into a professional science figure."
Step 3: AI Rendering
FigureLabs preserves your layout but replaces your messy scribbles with professional, scientifically accurate assets.
The Secret Weapon: The Figure Vectorizer (SVG)
This is where FigureLabs truly disrupts the market. Most AI tools only give you a flat image (JPG/PNG). If you need to change a label or move an element for a specific journal requirement, you are stuck.
FigureLabs solves this:
- Take your AI-generated pathway.
- Click "Image Editing" → "Image vectorization".
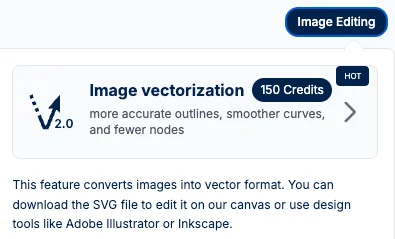
Dual Action: The system will automatically download the SVG file to your computer (so you have a local backup) AND simultaneously open the Image Vector Editor in your browser.
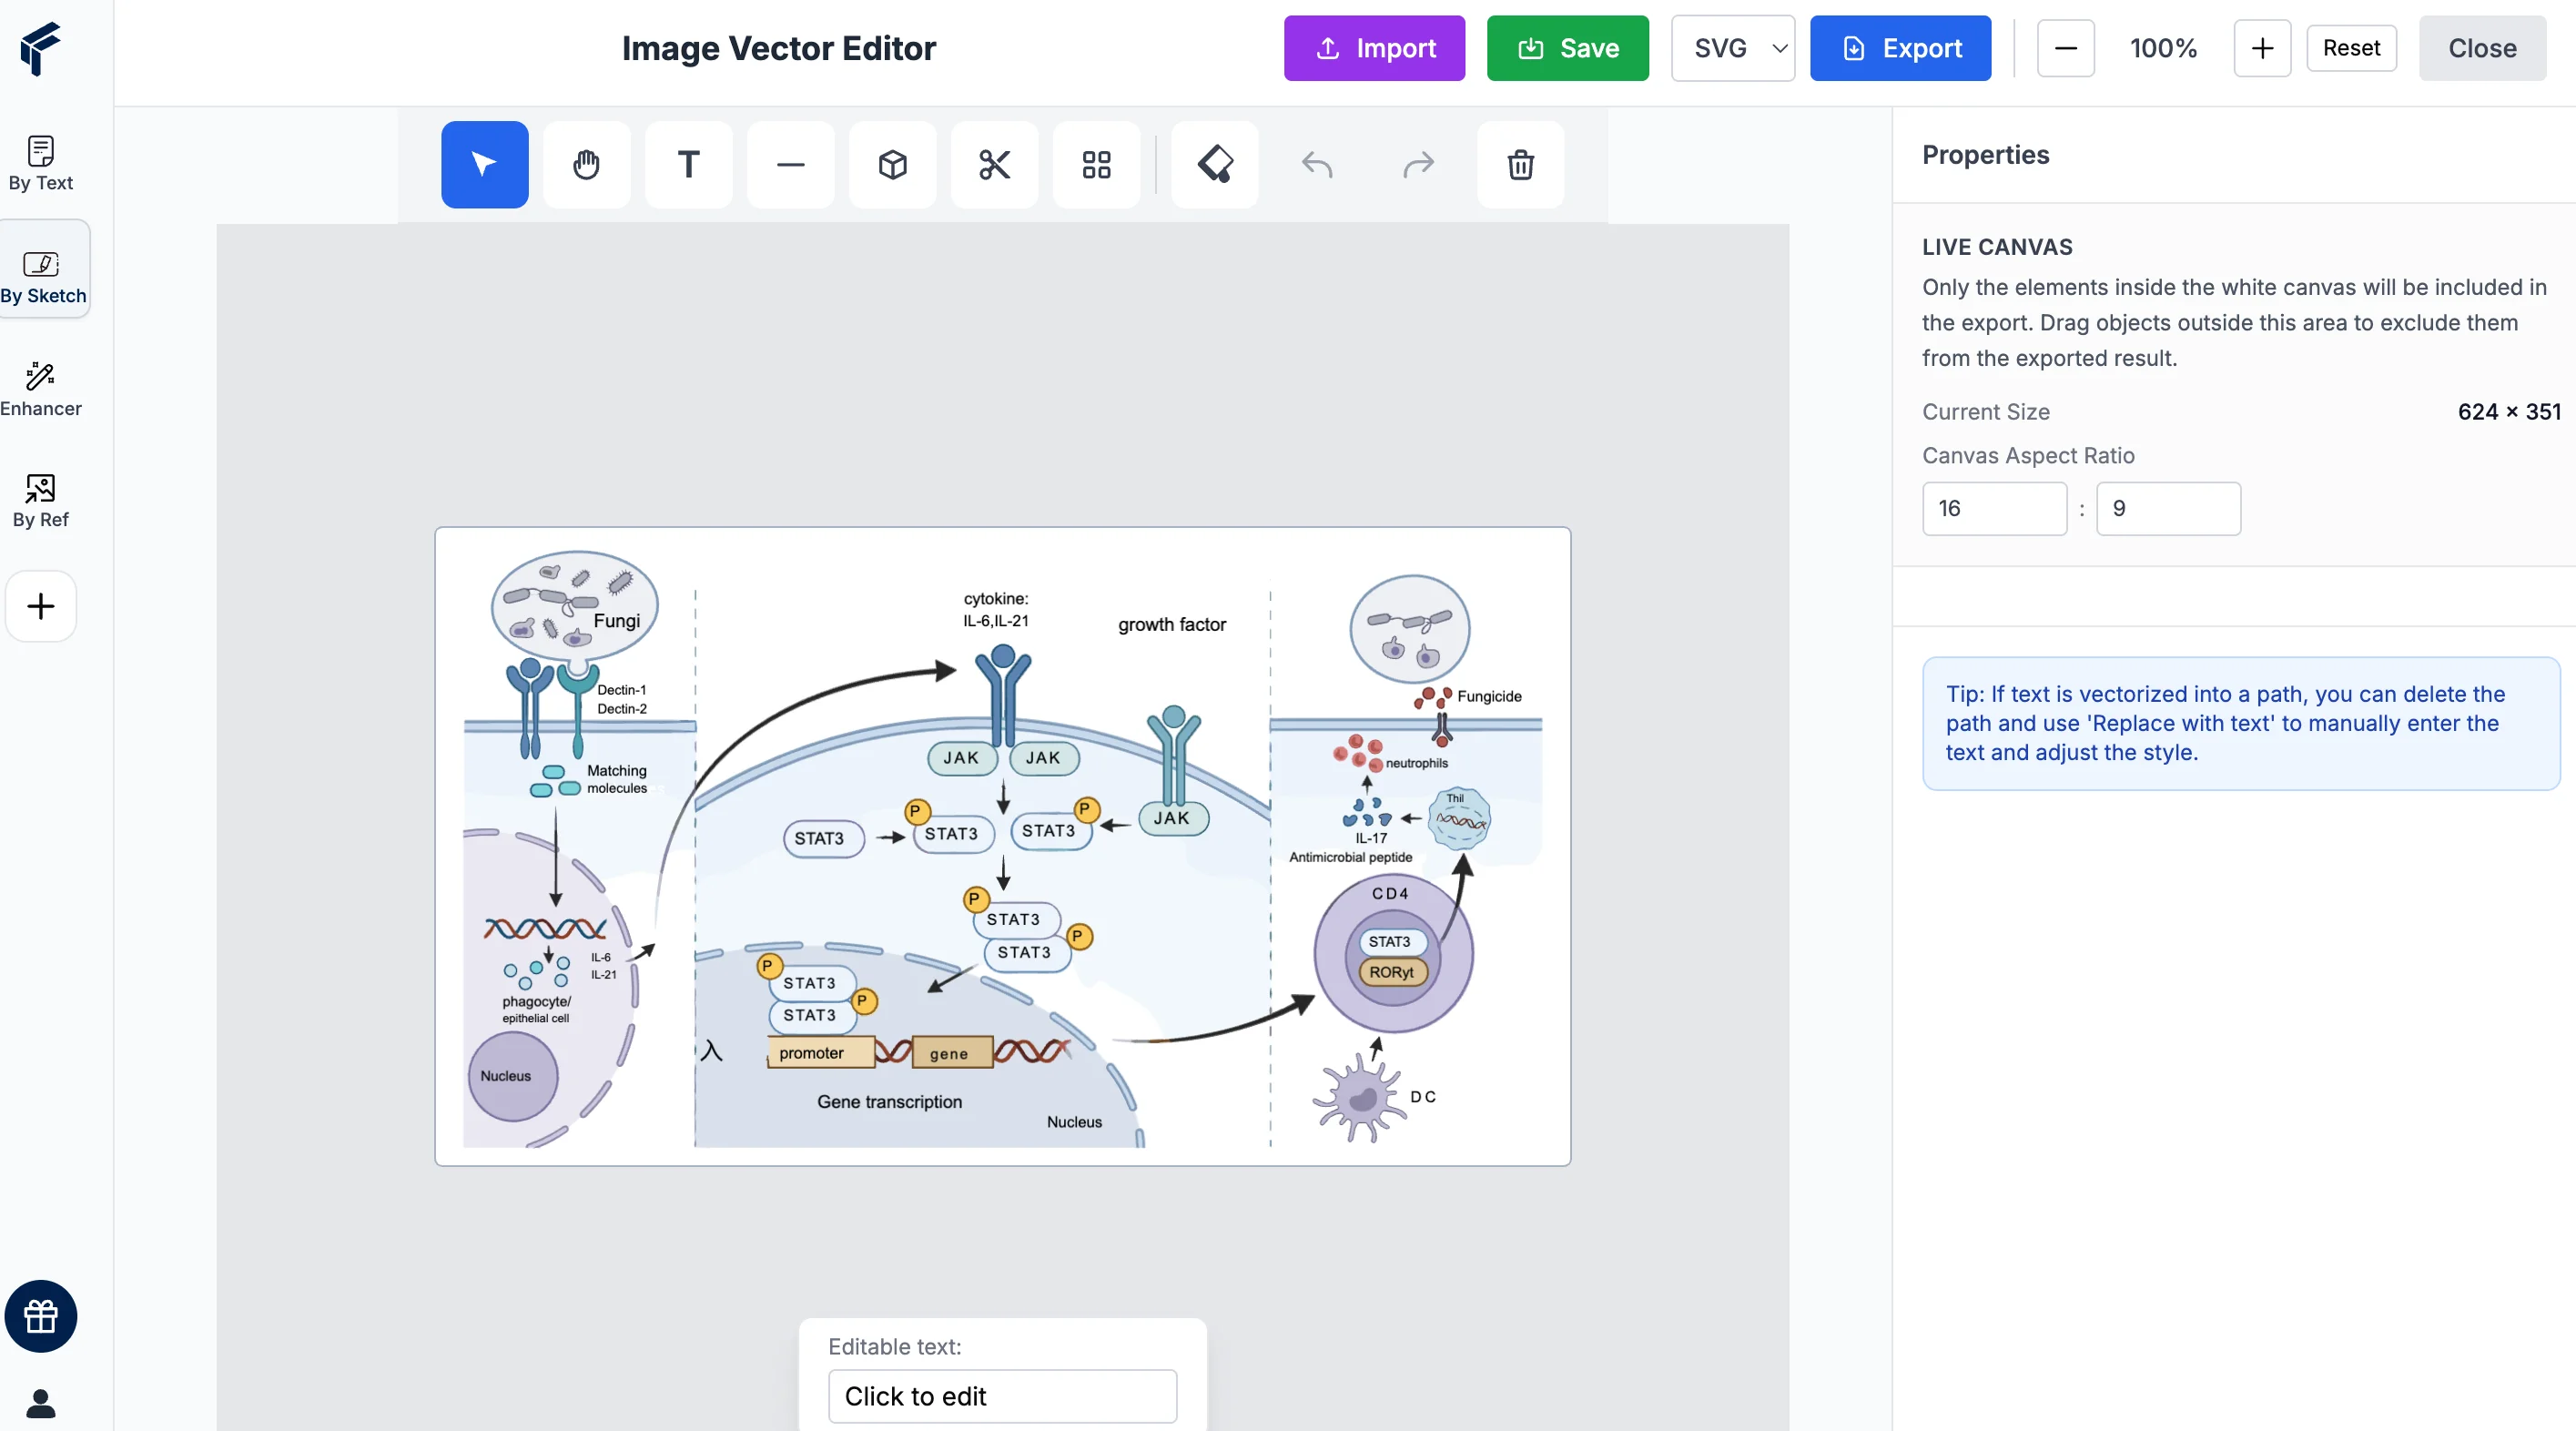
Edit Instantly: You don't need to leave the website. Inside the editor, you can:
- Fix Text: Use the "Replace with text" feature to convert vectorized shapes into editable text fields.
- Adjust Layout: Move elements, change colors, or refine curves.
- Save: Once finished, you can export the updated SVG version
Summary
Stop treating scientific illustration like an art project. You are a scientist, not a graphic designer.
Whether you need a classic Apoptosis pathway or a novel mechanism for your latest paper, FigureLabs acts as your intelligent assistant, handling the visuals so you can focus on the data.
Ready to save 3 hours on your next figure? 👉 Try FigureLabs for Free